¶ Grafana
¶ 개요
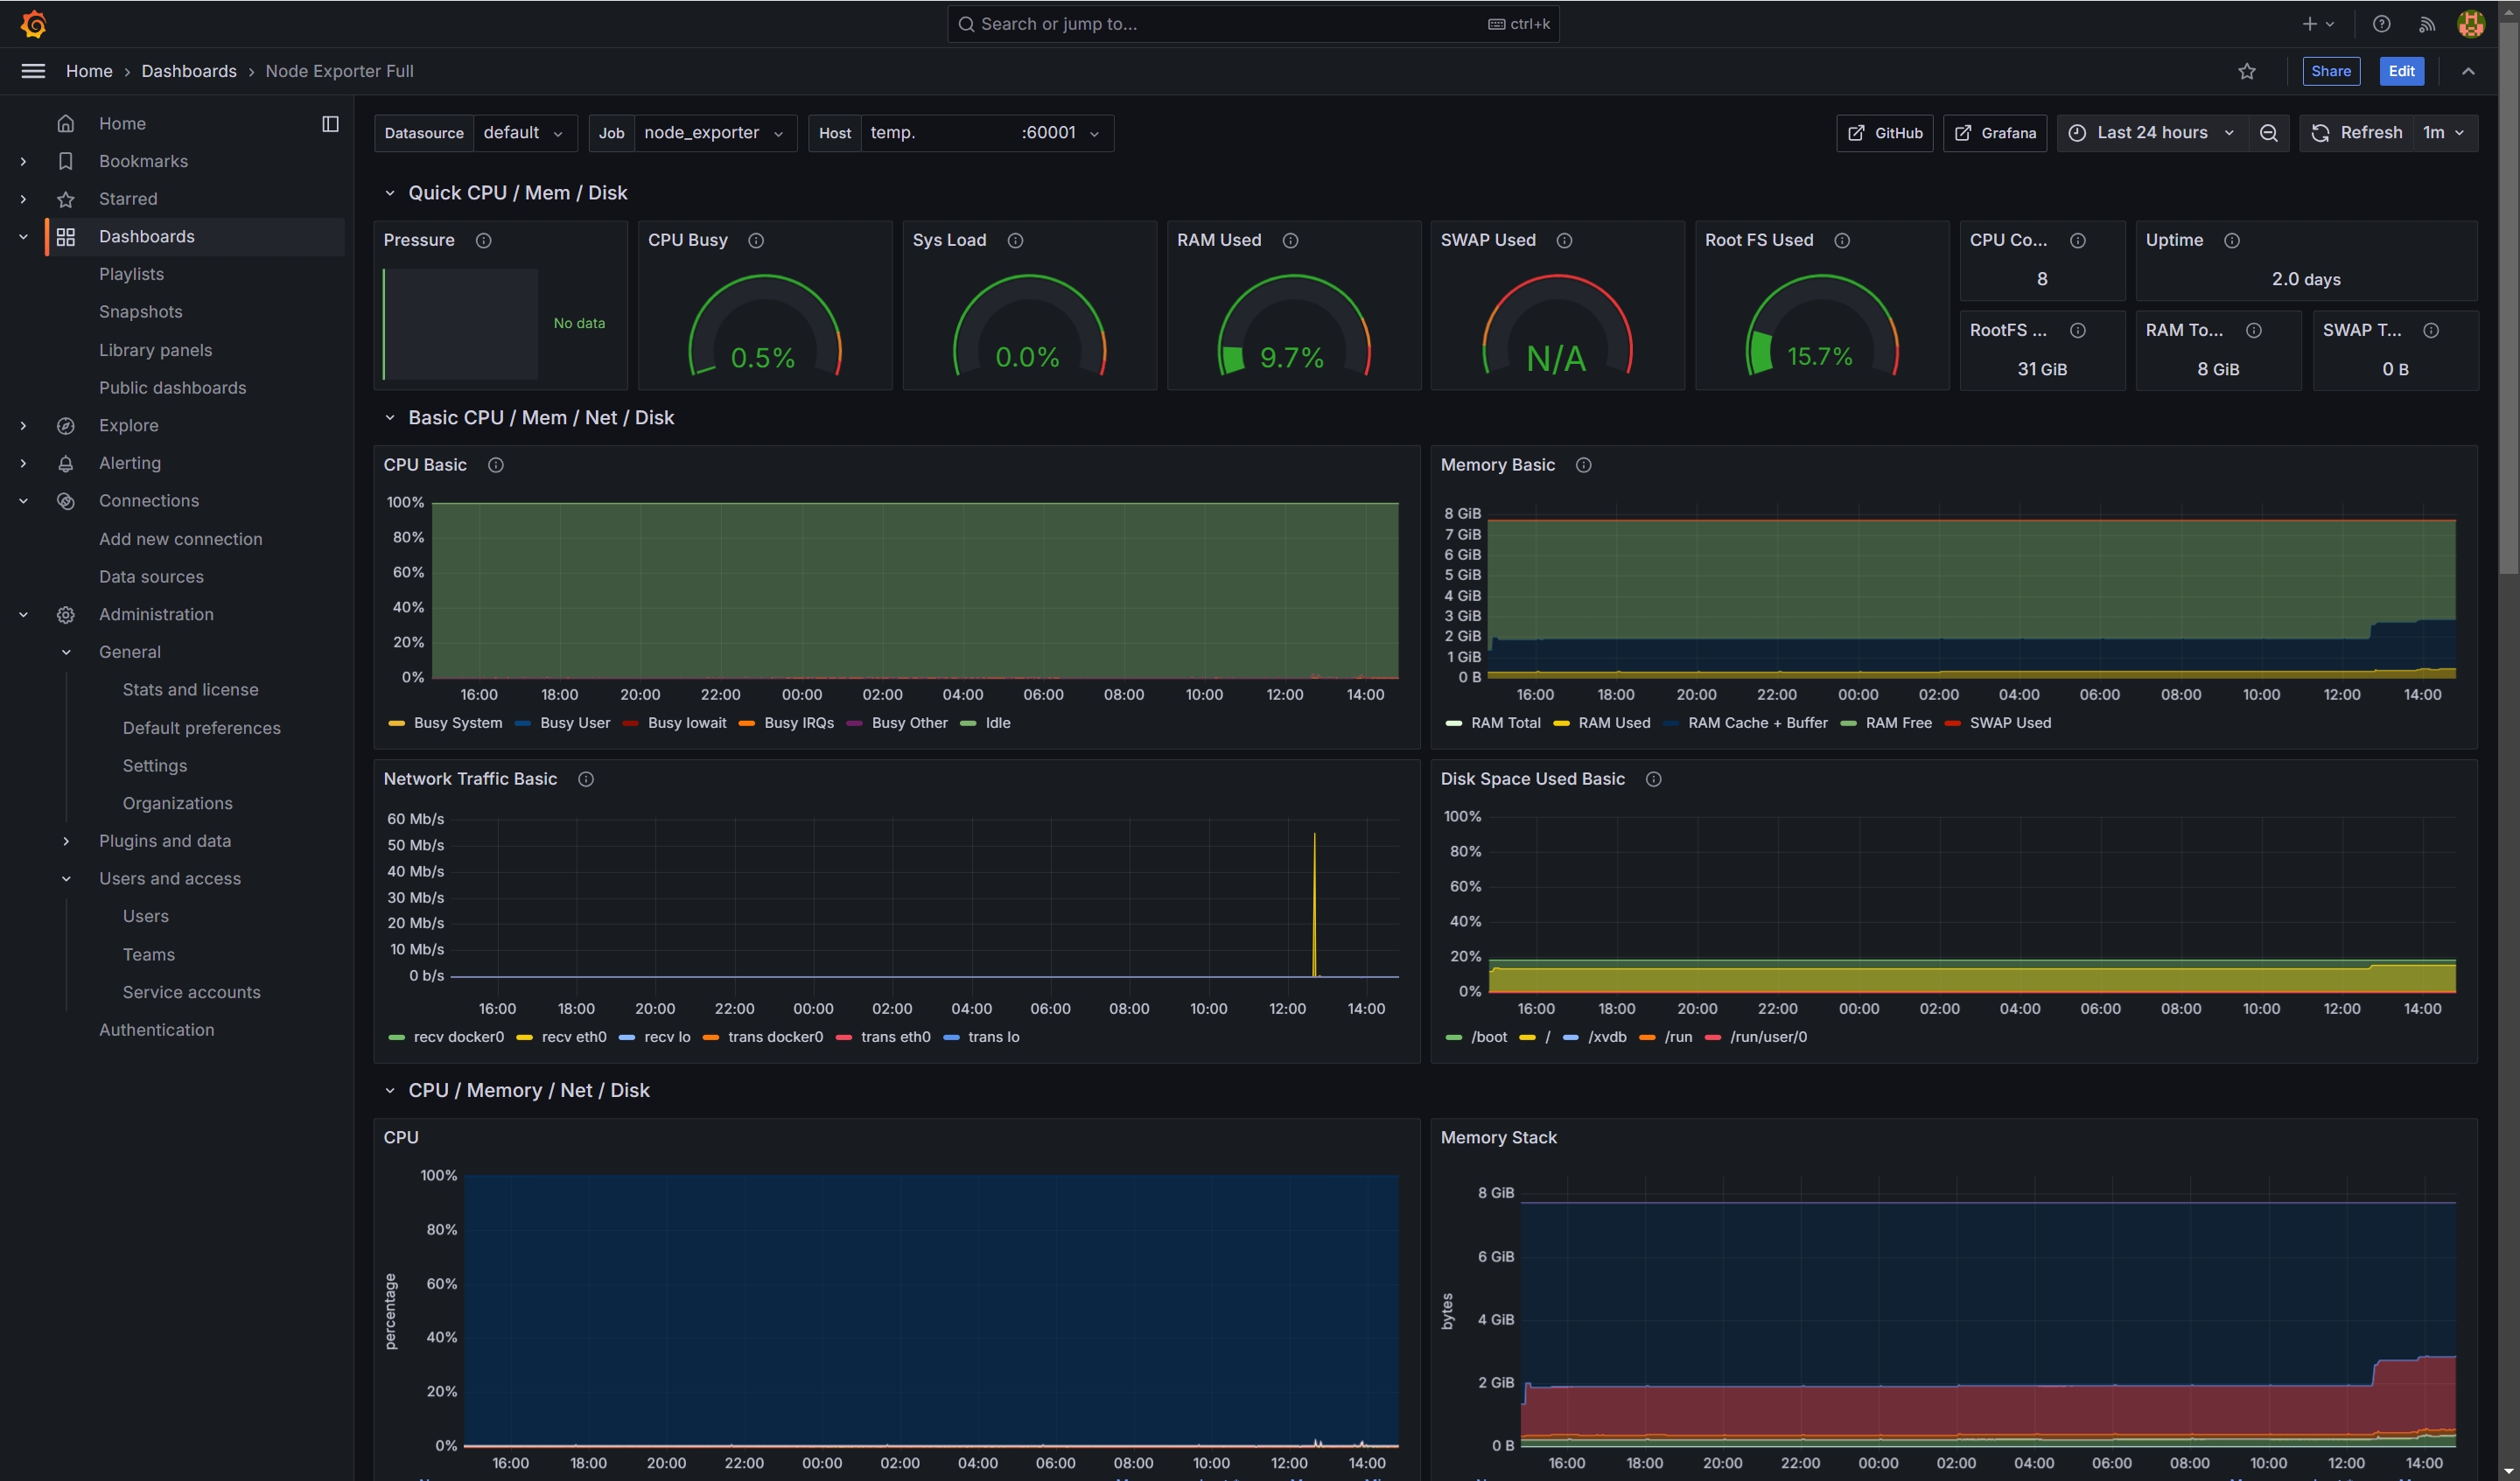
Grafana 는 시계열 데이터를 시각화하는 오픈소스 플랫폼이다. Prometheus · Loki · Elasticsearch · OpenSearch · RDBMS 를 데이터 소스로 붙여 한 화면에서 본다. 경고 규칙도 Grafana 에서 직접 평가할 수 있다(Unified Alerting).
현행 버전은 OSS 13.2.2[1] 이고 라이선스는 AGPLv3 다. 기본 포트는 3000 이다.
설치는 Grafana 설치 에 따로 있다. 이 문서의 뒷부분은 운영 중인 인스턴스의 systemd 유닛과 grafana.ini 전문 기록이다.
Grafana는 데이터를 시각화하고 모니터링하기 위한 오픈소스 플랫폼이다. 주로 실시간 데이터 분석 및 대시보드 생성에 사용되며, IT 인프라 모니터링, DevOps, IoT 데이터 분석 등 다양한 분야에서 활용된다. Grafana는 데이터를 다양한 형태의 그래프로 표현하고, 여러 데이터 소스와 통합하여 유용한 통찰을 제공한다.
¶ 운영 기록
¶ systemd service 파일
[Unit]
Description=Grafana service
Wants=network-online.target
After=network-online.target

[Service]
User=grafana
Group=grafana
Type=simple
WorkingDirectory=/opt/grafana
ExecStart=/opt/grafana/bin/grafana-server \
  --config=/etc/grafana/grafana.ini \
  --homepath=/opt/grafana \
  --packaging=systemd \
  cfg:default.paths.logs=/var/log/grafana \
  cfg:default.paths.data=/var/lib/grafana \
  cfg:default.paths.plugins=/var/lib/grafana/plugins
StandardOutput=append:/var/log/grafana/grafana.log
StandardError=append:/var/log/grafana/grafana.err
Restart=always
LimitNOFILE=10000

[Install]
WantedBy=multi-user.target
¶ grafana.ini
app_mode = production
instance_name = monitor.haedongg.net

[paths]
data = /xvdb/grafana/data
temp_data_lifetime = 24h
logs = /xvdb/grafana/data/log
plugins = /xvdb/grafana/data/plugins
provisioning = /etc/grafana/provisioning
permitted_provisioning_paths = devenv/dev-dashboards|conf/provisioning

[server]
protocol = https
min_tls_version = ""
http_addr = 0.0.0.0
http_port = 8443
domain = monitor.haedongg.net
enforce_domain = false
root_url = %(protocol)s://%(domain)s:%(http_port)s/
serve_from_sub_path = false
router_logging = false
static_root_path = public
enable_gzip = false
cert_file = /etc/grafana/public.crt
cert_key = /etc/grafana/private.key
cert_pass =
certs_watch_interval =
socket_gid = -1
socket_mode = 0660
socket = /tmp/grafana.sock
cdn_url =
read_timeout = 0

[server.custom_response_headers]
#exampleHeader1 = exampleValue1
#exampleHeader2 = exampleValue2

[environment]
local_file_system_available = true

[grpc_server]
network = "tcp"
address = "127.0.0.1:10000"
use_tls = false
cert_file =
key_file =
enable_logging = false

max_recv_msg_size =

max_send_msg_size =

#################################### Database ############################
[database]
# You can configure the database connection by specifying type, host, name, user and password
# as separate properties or as on string using the url property.

# Either "mysql", "postgres" or "sqlite3", it's your choice
type = postgres
host = monitor.haedongg.net:5432
name = grafana
user = grafana
password = ${REDACTED}
# Example: mysql://user:secret@host:port/database
url =
high_availability = false
max_idle_conn = 2
max_open_conn =
conn_max_lifetime = 14400
log_queries =
ssl_mode = disable
ssl_sni =
isolation_level =

ca_cert_path =
client_key_path =
client_cert_path =
server_cert_name =

path = grafana.db
cache_mode = private
wal = false
migration_locking = true
locking_attempt_timeout_sec = 0
query_retries = 0
transaction_retries = 5
instrument_queries = false

[remote_cache]
type = redis

# redis: config like redis server e.g. `addr=127.0.0.1:6379,pool_size=100,db=0,username=grafana,password=${REDACTED},ssl=false`. Only addr is required. ssl may be 'true', 'false', or 'insecure'.
# memcache: 127.0.0.1:11211
connstr = addr=monitor.haedongg.net:6379
prefix = grafana_
encryption =

#################################### Data proxy ###########################
[dataproxy]

logging = false
timeout = 30
dialTimeout = 10
keep_alive_seconds = 30
tls_handshake_timeout_seconds = 10
expect_continue_timeout_seconds = 1
max_conns_per_host = 0
max_idle_connections = 300
idle_conn_timeout_seconds = 90
send_user_header = false
response_limit = 0
row_limit = 1000000
user_agent =

#################################### Analytics ###########################
[analytics]
reporting_enabled = true
reporting_distributor = grafana-labs
check_for_updates = true
check_for_plugin_updates = true
google_analytics_ua_id =
google_analytics_4_id =
google_analytics_4_send_manual_page_views = false
google_tag_manager_id =
rudderstack_write_key =
rudderstack_data_plane_url =
rudderstack_sdk_url =
rudderstack_config_url =
rudderstack_integrations_url =
intercom_secret =
${REDACTED} =
application_insights_endpoint_url =
feedback_links_enabled = true
reporting_static_context =
browser_console_reporter = false

#################################### Security ############################
[security]
disable_initial_admin_creation = false
admin_user = admin
admin_password = ${REDACTED}
admin_email = haedongg@gmail.com
secret_key = ${MASKED}
encryption_provider = secretKey.v1
available_encryption_providers =
disable_gravatar = false
data_source_proxy_whitelist =
disable_brute_force_login_protection = false
brute_force_login_protection_max_attempts = 5
disable_ip_address_login_protection = true
cookie_secure = false
cookie_samesite = lax
allow_embedding = false
strict_transport_security = false
strict_transport_security_max_age_seconds = 86400
strict_transport_security_preload = false
strict_transport_security_subdomains = false
x_content_type_options = true
x_xss_protection = true
content_security_policy = false
content_security_policy_template = """script-src 'self' 'unsafe-eval' 'unsafe-inline' 'strict-dynamic' $NONCE;object-src 'none';font-src 'self';style-src 'self' 'unsafe-inline' blob:;img-src * data:;base-uri 'self';connect-src 'self' grafana.com ws://$ROOT_PATH wss://$ROOT_PATH;manifest-src 'self';media-src 'none';form-action 'self';"""
content_security_policy_report_only = false
content_security_policy_report_only_template = """script-src 'self' 'unsafe-eval' 'unsafe-inline' 'strict-dynamic' $NONCE;object-src 'none';font-src 'self';style-src 'self' 'unsafe-inline' blob:;img-src * data:;base-uri 'self';connect-src 'self' grafana.com ws://$ROOT_PATH wss://$ROOT_PATH;manifest-src 'self';media-src 'none';form-action 'self';"""
angular_support_enabled = false
csrf_always_check = false
enable_frontend_sandbox_for_plugins =
actions_allow_post_url =

[security.encryption]
data_keys_cache_ttl = 15m
data_keys_cache_cleanup_interval = 1m

#################################### Snapshots ###########################
[snapshots]
enabled = true
external_enabled = true
external_snapshot_url = https://snapshots.raintank.io
external_snapshot_name = Publish to snapshots.raintank.io

# Set to true to enable this Grafana instance act as an external snapshot server and allow unauthenticated requests for
# creating and deleting snapshots.
public_mode = false

#################################### Dashboards ##################

[dashboards]
versions_to_keep = 10
min_refresh_interval = 5s
# Path to the default home dashboard. If this value is empty, then Grafana uses StaticRootPath + "dashboards/home.json"
default_home_dashboard_path =
dashboard_performance_metrics =
panel_series_limit =

################################### Data sources #########################
[datasources]
# Upper limit of data sources that Grafana will return. This limit is a temporary configuration and it will be deprecated when pagination will be introduced on the list data sources API.
datasource_limit = 5000
concurrent_query_count = 10
default_manage_alerts_ui_toggle = true
default_allow_recording_rules_target_alerts_ui_toggle = true

################################### SQL Data Sources #####################
[sql_datasources]
max_open_conns_default = 100
max_idle_conns_default = 100
max_conn_lifetime_default = 14400

#################################### Users ###############################
[users]
allow_sign_up = true
allow_org_create = false
auto_assign_org = true
auto_assign_org_id = 1
auto_assign_org_role = Viewer
verify_email_enabled = false
login_default_org_id =
login_hint =
password_hint =
default_theme = system
default_language = en-US
home_page =

# External user management
external_manage_link_url =
external_manage_link_name =
external_manage_info =
viewers_can_edit = false
editors_can_admin = false
user_invite_max_lifetime_duration = 24h
verification_email_max_lifetime_duration = 1h
last_seen_update_interval = 15m
hidden_users =

[secretscan]
enabled = false
interval = 5m
base_url = https://secret-scanning.grafana.net
oncall_url =
revoke = true

[service_accounts]
token_expiration_day_limit =

[auth]
login_cookie_name = grafana_session
disable_login = false
login_maximum_inactive_lifetime_duration =
login_maximum_lifetime_duration =
token_rotation_interval_minutes = 10
disable_login_form = false
disable_signout_menu = false
signout_redirect_url =
oauth_auto_login = false
oauth_state_cookie_max_age = 600
oauth_login_error_message = oauth.login.error
oauth_refresh_token_server_lock_min_wait_ms = 1000
api_key_max_seconds_to_live = -1
sigv4_auth_enabled = false
sigv4_verbose_logging = false
azure_auth_enabled = false
oauth_allow_insecure_email_lookup = false
id_response_header_enabled = false
id_response_header_prefix = X-Grafana
id_response_header_namespaces = user api-key service-account
managed_service_accounts_enabled = false

#################################### Passwordless Auth ###########################
[auth.passwordless]
enabled = false
code_expiration = 20m

#################################### SSO Settings ###########################
[sso_settings]
reload_interval = 1m
configurable_providers = github gitlab google generic_oauth azuread okta

#################################### Anonymous Auth ######################
[auth.anonymous]
enabled = false
org_name = Main Org.
org_role = Viewer
hide_version = false
device_limit =

#################################### GitHub Auth #########################
[auth.github]
name = GitHub
icon = github
enabled = false
allow_sign_up = true
auto_login = false
client_id = some_id
client_secret =
${REDACTED} = user:email,read:org
auth_url = https://github.com/login/oauth/authorize
token_url = https://github.com/login/oauth/access_token
api_url = https://api.github.com/user
signout_redirect_url =
allowed_domains =
team_ids =
allowed_organizations =
role_attribute_path =
role_attribute_strict = false
org_mapping =
allow_assign_grafana_admin = false
skip_org_role_sync = false
tls_skip_verify_insecure = false
tls_client_cert =
tls_client_key =
tls_client_ca =
# GitHub OAuth apps does not provide refresh tokens and the access tokens never expires.
use_refresh_token = false

#################################### GitLab Auth #########################
[auth.gitlab]
name = GitLab
icon = gitlab
enabled = false
allow_sign_up = true
auto_login = false
client_id = some_id
client_secret =
${REDACTED} = openid email profile
auth_url = https://gitlab.com/oauth/authorize
token_url = https://gitlab.com/oauth/token
api_url = https://gitlab.com/api/v4
signout_redirect_url =
allowed_domains =
allowed_groups =
role_attribute_path =
role_attribute_strict = false
org_mapping =
allow_assign_grafana_admin = false
skip_org_role_sync = false
tls_skip_verify_insecure = false
tls_client_cert =
tls_client_key =
tls_client_ca =
use_pkce = true
use_refresh_token = true

#################################### Google Auth #########################
[auth.google]
name = Google
icon = google
enabled = false
allow_sign_up = true
auto_login = false
client_id = some_client_id
client_secret =
${REDACTED} = openid email profile
auth_url = https://accounts.google.com/o/oauth2/v2/auth
token_url = https://oauth2.googleapis.com/token
api_url = https://openidconnect.googleapis.com/v1/userinfo
signout_redirect_url =
allowed_domains =
validate_hd = true
hosted_domain =
allowed_groups =
role_attribute_path =
role_attribute_strict = false
org_mapping =
allow_assign_grafana_admin = false
skip_org_role_sync = true
tls_skip_verify_insecure = false
tls_client_cert =
tls_client_key =
tls_client_ca =
use_pkce = true
use_refresh_token = true

#################################### Grafana.com Auth ####################
# legacy key names (so they work in env variables)
[auth.grafananet]
enabled = false
allow_sign_up = true
client_id = some_id
client_secret =
${REDACTED} = user:email
allowed_organizations =
use_refresh_token = false

[auth.grafana_com]
name = Grafana.com
icon = grafana
enabled = false
allow_sign_up = true
auto_login = false
client_id = some_id
client_secret =
${REDACTED} = user:email
allowed_organizations =
skip_org_role_sync = false
use_refresh_token = false

#################################### Azure AD OAuth #######################
[auth.azuread]
name = Microsoft
icon = microsoft
enabled = false
allow_sign_up = true
auto_login = false
client_authentication =
client_id = some_client_id
client_secret =
${REDACTED} =
federated_credential_audience =
workload_identity_token_file = /var/run/secrets/azure/tokens/azure-identity-token
scopes = openid email profile
auth_url = https://login.microsoftonline.com/<tenant-id>/oauth2/v2.0/authorize
token_url = https://login.microsoftonline.com/<tenant-id>/oauth2/v2.0/token
signout_redirect_url =
allowed_domains =
allowed_groups =
allowed_organizations =
role_attribute_strict = false
org_mapping =
allow_assign_grafana_admin = false
force_use_graph_api = false
tls_skip_verify_insecure = false
tls_client_cert =
tls_client_key =
tls_client_ca =
use_pkce = true
skip_org_role_sync = false
use_refresh_token = true

#################################### Okta OAuth #######################
[auth.okta]
name = Okta
icon = okta
enabled = false
allow_sign_up = true
auto_login = false
client_id = some_id
client_secret =
${REDACTED} = openid profile email groups
auth_url = https://<tenant-id>.okta.com/oauth2/v1/authorize
token_url = https://<tenant-id>.okta.com/oauth2/v1/token
api_url = https://<tenant-id>.okta.com/oauth2/v1/userinfo
signout_redirect_url =
allowed_domains =
allowed_groups =
role_attribute_path =
role_attribute_strict = false
org_attribute_path =
org_mapping =
allow_assign_grafana_admin = false
skip_org_role_sync = false
tls_skip_verify_insecure = false
tls_client_cert =
tls_client_key =
tls_client_ca =
use_pkce = true
use_refresh_token = false

#################################### Generic OAuth #######################
[auth.generic_oauth]
name = OAuth
icon = signin
enabled = false
allow_sign_up = true
auto_login = false
client_id = some_id
client_secret =
${REDACTED} = user:email
empty_scopes = false
email_attribute_name = email:primary
email_attribute_path =
login_attribute_path =
name_attribute_path =
role_attribute_path =
role_attribute_strict = false
org_attribute_path =
org_mapping =
groups_attribute_path =
id_token_attribute_name =
team_ids_attribute_path =
auth_url =
token_url =
api_url =
signout_redirect_url =
teams_url =
allowed_domains =
allowed_groups =
team_ids =
allowed_organizations =
tls_skip_verify_insecure = false
tls_client_cert =
tls_client_key =
tls_client_ca =
use_pkce = false
auth_style =
allow_assign_grafana_admin = false
skip_org_role_sync = false
use_refresh_token = false

#################################### Basic Auth ##########################
[auth.basic]
enabled = true
# 1. Have a minimum of 12 characters
# 2. Composed by at least 1 uppercase character
# 3. Composed by at least 1 lowercase character
# 4. Composed by at least 1 digit character
# 5. Composed by at least 1 symbol character
password_policy = false

#################################### Auth Proxy ##########################
[auth.proxy]
enabled = false
header_name = X-WEBAUTH-USER
header_property = username
auto_sign_up = true
sync_ttl = 15
whitelist =
headers =
headers_encoded = false
enable_login_token = false

#################################### Auth JWT ##########################
[auth.jwt]
enabled = false
enable_login_token = false
header_name =
email_claim =
username_claim =
email_attribute_path =
username_attribute_path =
jwk_set_url =
jwk_set_file =
cache_ttl = 60m
expect_claims = {}
key_file =
key_id =
role_attribute_path =
role_attribute_strict = false
org_attribute_path =
org_mapping =
groups_attribute_path =
auto_sign_up = false
url_login = false
allow_assign_grafana_admin = false
skip_org_role_sync = false
tls_skip_verify_insecure = false

#################################### Auth LDAP ###########################
[auth.ldap]
enabled = false
config_file = /etc/grafana/ldap.toml
allow_sign_up = true
skip_org_role_sync = false

# LDAP background sync (Enterprise only)
# At 1 am every day
sync_cron = "0 1 * * *"
active_sync_enabled = true

#################################### AWS #####################################
[aws]
allowed_auth_providers = default,keys,credentials
assume_role_enabled = true
list_metrics_page_limit = 500
external_id =
session_duration = "15m"
forward_settings_to_plugins = cloudwatch, grafana-athena-datasource, grafana-redshift-datasource, grafana-x-ray-datasource, grafana-timestream-datasource, grafana-iot-sitewise-datasource, grafana-iot-twinmaker-app, grafana-opensearch-datasource, aws-datasource-provisioner, elasticsearch, prometheus, grafana-amazonprometheus-datasource, grafana-aurora-datasource

#################################### Azure ###############################
[azure]
cloud = AzureCloud
clouds_config =
managed_identity_enabled = false
managed_identity_client_id =
workload_identity_enabled = false
workload_identity_tenant_id =
workload_identity_client_id =
workload_identity_token_file =
user_identity_enabled = false
user_identity_fallback_credentials_enabled = true
user_identity_token_url =
user_identity_client_authentication =
user_identity_client_id =
user_identity_client_secret =
${REDACTED} =
user_identity_federated_credential_audience =
username_assertion =
forward_settings_to_plugins = grafana-azure-monitor-datasource, prometheus, grafana-azure-data-explorer-datasource, mssql, grafana-azureprometheus-datasource
azure_entra_password_credentials_enabled = false

#################################### Role-based Access Control ###########
[rbac]
permission_cache = true
reset_basic_roles = false
permission_validation_enabled = true

#################################### SMTP / Emailing #####################
[smtp]
enabled = false
host = localhost:25
user =
# If the password contains # or ; you have to wrap it with triple quotes. Ex """#password;"""
password =
${REDACTED} =
key_file =
skip_verify = false
from_address = admin@grafana.localhost
from_name = Grafana
ehlo_identity =
startTLS_policy =
enable_tracing = false

[smtp.static_headers]

[emails]
welcome_email_on_sign_up = false
templates_pattern = emails/*.html, emails/*.txt
content_types = text/html

#################################### Logging ##########################
[log]
mode = console file
level = info
filters =
user_facing_default_error = "please inspect Grafana server log for details"
[log.console]
level =
format = console
[log.file]
level =
format = text
log_rotate = true
max_lines = 1000000
max_size_shift = 28
daily_rotate = true
max_days = 7

[log.syslog]
level =
format = text
network =
address =
facility =
tag =

[log.frontend]
enabled = false
custom_endpoint =
log_endpoint_requests_per_second_limit = 3
log_endpoint_burst_limit = 15
instrumentations_all_enabled = false
instrumentations_errors_enabled = true
instrumentations_console_enabled = false
instrumentations_webvitals_enabled = false
instrumentations_tracing_enabled = false
internal_logger_level = 0
api_key =

#################################### Usage Quotas ########################
[quota]
enabled = false
org_user = 10
org_dashboard = 100
org_data_source = 10
org_api_key = 10
org_alert_rule = 100
user_org = 10
global_user = -1
global_org = -1
global_dashboard = -1
global_api_key = -1
global_session = -1
global_alert_rule = -1
global_file = 1000
global_correlations = -1
alerting_rule_group_rules = 100
alerting_rule_evaluation_results = -1

#################################### Unified Alerting ####################
[unified_alerting]
enabled =
disabled_orgs =
initialization_timeout = 30s
admin_config_poll_interval = 60s
alertmanager_config_poll_interval = 60s
alertmanager_max_silences_count =
alertmanager_max_silence_size_bytes =
ha_redis_address =
ha_redis_cluster_mode_enabled = false
ha_redis_sentinel_mode_enabled = false
ha_redis_sentinel_master_name =
ha_redis_username =
ha_redis_password =
${REDACTED} =
ha_redis_sentinel_password =
${REDACTED} =
ha_redis_prefix =
ha_redis_peer_name =
ha_redis_max_conns = 5
ha_redis_tls_enabled = false
ha_redis_tls_cert_path =
ha_redis_tls_key_path =
ha_redis_tls_ca_path =
ha_redis_tls_server_name =
ha_redis_tls_insecure_skip_verify =
ha_redis_tls_cipher_suites =
ha_redis_tls_min_version =
ha_listen_address = "0.0.0.0:9094"
ha_advertise_address = ""
ha_peers = ""
ha_peer_timeout = 15s
ha_label =
ha_gossip_interval = 200ms
ha_reconnect_timeout = 6h
ha_push_pull_interval = 60s
execute_alerts = true
evaluation_timeout = 30s
max_attempts = 3
min_interval = 10s
max_state_save_concurrency = 1
state_periodic_save_interval = 5m
state_periodic_save_batch_size = 1
disable_jitter = false
notification_log_retention = 5d
resolved_alert_retention = 15m
rule_version_record_limit = 0
deleted_rule_retention = 30d

[unified_alerting.screenshots]
capture = false
capture_timeout = 10s
max_concurrent_screenshots = 5
upload_external_image_storage = false

[unified_alerting.reserved_labels]
disabled_labels =

[unified_alerting.state_history]
enabled = true
backend =
# For "multiple" only.
primary =
# For "multiple" only.
secondaries =
# For "loki" only.
loki_remote_url =
# For "loki" only.
loki_remote_read_url =
# For "loki" only.
loki_remote_write_url =
# For "loki" only.
loki_tenant_id =
# For "loki" only.
loki_basic_auth_username =
# For "loki" only.
loki_basic_auth_password =
# For "loki" only.
loki_max_query_length = 721h
# For "loki" only.
loki_max_query_size = 65536

# For "prometheus" only.
prometheus_target_datasource_uid =

# For "prometheus" only.
prometheus_metric_name = GRAFANA_ALERTS
# For "prometheus" only.
prometheus_write_timeout = 10s

[unified_alerting.state_history.external_labels]
# mylabelkey = mylabelvalue

[unified_alerting.state_history.annotations]
max_age =
max_annotations_to_keep =

[unified_alerting.prometheus_conversion]
rule_query_offset = 1m

[recording_rules]
enabled = true
timeout = 10s
default_datasource_uid =
[recording_rules.custom_headers]
# exampleHeader = exampleValue

[remote.alertmanager]
url =
tenant =
password =
${REDACTED} = 5m
timeout = 30s

#################################### Annotations #########################
[annotations]
cleanupjob_batchsize = 100
# Setting it to a higher value would impact performance therefore is not recommended.
tags_length = 500

[annotations.dashboard]
max_age =
max_annotations_to_keep =

[annotations.api]
max_age =
max_annotations_to_keep =

#################################### Explore #############################
[explore]
# Enable the Explore section
enabled = false
defaultTimeOffset = 1h
# hides the download logs button in Explore
hide_logs_download = false

#################################### Help #############################
[help]
# Enable the Help section
enabled = true

#################################### Profile #############################
[profile]
# Enable the Profile section
enabled = true

#################################### News #############################
[news]
# Enable the news feed section
news_feed_enabled = false

#################################### Query #############################
[query]
concurrent_query_limit =

#################################### Query History #############################
[query_history]
enabled = true

#################################### Short Links #############################
[short_links]
expire_time = 7

#################################### Internal Grafana Metrics ############
# Metrics available at HTTP URL /metrics and /metrics/plugins/:pluginId
[metrics]
enabled = true
interval_seconds = 10
disable_total_stats = false
total_stats_collector_interval_seconds = 1800
basic_auth_username =
basic_auth_password =
${REDACTED}
#exampleLabel1 = exampleValue1
#exampleLabel2 = exampleValue2

[metrics.graphite]
address =
prefix = prod.grafana.%(instance_name)s.

#################################### Grafana.com integration  ##########################
[grafana_net]
url = https://grafana.com

[grafana_com]
url = https://grafana.com
api_url = https://grafana.com/api
sso_api_token = ""

#################################### Distributed tracing ############
# Opentracing is deprecated use opentelemetry instead
[tracing.jaeger]
# jaeger destination (ex localhost:6831)
address =
# tag that will always be included in when creating new spans. ex (tag1:value1,tag2:value2)
always_included_tag =
# Type specifies the type of the sampler: const, probabilistic, rateLimiting, or remote
sampler_type = const
# jaeger samplerconfig param
# for "const" sampler, 0 or 1 for always false/true respectively
# for "probabilistic" sampler, a probability between 0 and 1
# for "rateLimiting" sampler, the number of spans per second
# for "remote" sampler, param is the same as for "probabilistic"
# and indicates the initial sampling rate before the actual one
# is received from the mothership
sampler_param = 1
# sampling_server_url is the URL of a sampling manager providing a sampling strategy.
sampling_server_url =
# Whether or not to use Zipkin span propagation (x-b3- HTTP headers).
zipkin_propagation = false
# Setting this to true disables shared RPC spans.
# Not disabling is the most common setting when using Zipkin elsewhere in your infrastructure.
disable_shared_zipkin_spans = false

[tracing.opentelemetry]

# attributes that will always be included in when creating new spans. ex (key1:value1,key2:value2)
custom_attributes =
# Type specifies the type of the sampler: const, probabilistic, rateLimiting, or remote
sampler_type =
# Sampler configuration parameter
# for "const" sampler, 0 or 1 for always false/true respectively
# for "probabilistic" sampler, a probability between 0.0 and 1.0
# for "rateLimiting" sampler, the number of spans per second
# for "remote" sampler, param is the same as for "probabilistic"
#   and indicates the initial sampling rate before the actual one
#   is received from the sampling server (set at sampling_server_url)
sampler_param =
# specifies the URL of the sampling server when sampler_type is remote
sampling_server_url =

[tracing.opentelemetry.jaeger]
# jaeger destination (ex http://localhost:14268/api/traces)
address =
# Propagation specifies the text map propagation format: w3c, jaeger
propagation =

# This is a configuration for OTLP exporter with GRPC protocol
[tracing.opentelemetry.otlp]
# otlp destination (ex localhost:4317)
address =
# Propagation specifies the text map propagation format: w3c, jaeger
propagation =
# Toggles the insecure communication setting, defaults to `true`.
# When set to `false`, the OTLP client will use TLS credentials with the default system cert pool for communication.
insecure =

#################################### External Image Storage ##############
[external_image_storage]
# Used for uploading images to public servers so they can be included in slack/email messages.
# You can choose between (s3, webdav, gcs, azure_blob, local)
provider =

[external_image_storage.s3]
endpoint =
path_style_access =
bucket_url =
bucket =
region =
path =
access_key =
${REDACTED} =

[external_image_storage.webdav]
url =
username =
password =
${REDACTED} =

[external_image_storage.gcs]
key_file =
bucket =
path =
enable_signed_urls = false
signed_url_expiration =

[external_image_storage.azure_blob]
account_name =
account_key =
container_name =
sas_token_expiration_days =

[external_image_storage.local]
# does not require any configuration

[rendering]
# Options to configure a remote HTTP image rendering service, e.g. using https://github.com/grafana/grafana-image-renderer.
# URL to a remote HTTP image renderer service, e.g. http://localhost:8081/render, will enable Grafana to render panels and dashboards to PNG-images using HTTP requests to an external service.
server_url =
# If the remote HTTP image renderer service runs on a different server than the Grafana server you may have to configure this to a URL where Grafana is reachable, e.g. http://grafana.domain/.
# The `callback_url` can also be configured to support usage of the image renderer running as a plugin with support for SSL / HTTPS. For example https://localhost:3000/.
callback_url =
# An auth token that will be sent to and verified by the renderer. The renderer will deny any request without an auth token matching the one configured on the renderer side.
renderer_token = -
# Concurrent render request limit affects when the /render HTTP endpoint is used. Rendering many images at the same time can overload the server,
# which this setting can help protect against by only allowing a certain amount of concurrent requests.
concurrent_render_request_limit = 30
# Determines the lifetime of the render key used by the image renderer to access and render Grafana.
# This setting should be expressed as a duration. Examples: 10s (seconds), 5m (minutes), 2h (hours).
# Default is 5m. This should be more than enough for most deployments.
# Change the value only if image rendering is failing and you see `Failed to get the render key from cache` in Grafana logs.
render_key_lifetime = 5m
# Default width for panel screenshot
default_image_width = 1000
# Default height for panel screenshot
default_image_height = 500
# Default scale for panel screenshot
default_image_scale = 1

[panels]
# here for to support old env variables, can remove after a few months
enable_alpha = false
disable_sanitize_html = false

[plugins]
enable_alpha = false
app_tls_skip_verify_insecure = false
# Enter a comma-separated list of plugin identifiers to identify plugins to load even if they are unsigned. Plugins with modified signatures are never loaded.
allow_loading_unsigned_plugins =
# Enable or disable installing / uninstalling / updating plugins directly from within Grafana.
plugin_admin_enabled = true
plugin_admin_external_manage_enabled = false
plugin_catalog_url = https://grafana.com/grafana/plugins/
# Enter a comma-separated list of plugin identifiers to hide in the plugin catalog.
plugin_catalog_hidden_plugins =
# Log all backend requests for core and external plugins.
log_backend_requests = false
# Disable download of the public key for verifying plugin signature.
public_key_retrieval_disabled = false
# Force download of the public key for verifying plugin signature on startup. If disabled, the public key will be retrieved every 10 days.
# Requires public_key_retrieval_disabled to be false to have any effect.
public_key_retrieval_on_startup = false
# Enter a comma-separated list of plugin identifiers to avoid loading (including core plugins). These plugins will be hidden in the catalog.
disable_plugins =
# Comma separated list of plugin ids for which angular deprecation UI should be disabled
hide_angular_deprecation =
# Comma separated list of plugin ids for which environment variables should be forwarded. Used only when feature flag pluginsSkipHostEnvVars is enabled.
forward_host_env_vars =
# Comma separated list of plugin ids to install as part of the startup process.
# These will be installed, by default, asynchronously (in the background) while starting Grafana.
preinstall =
# Comma separated list of plugin ids to install before the startup process
# These will be installed before starting Grafana. Useful when used with provisioning.
preinstall_sync =
# Disables preinstall feature. It has the same effect as setting preinstall to an empty list.
preinstall_disabled = false
# Update strategy for plugins.
# Available options: "latest", "minor"
update_strategy = minor

#################################### Grafana Live ##########################################
[live]
# max_connections to Grafana Live WebSocket endpoint per Grafana server instance. See Grafana Live docs
# if you are planning to make it higher than default 100 since this can require some OS and infrastructure
# tuning. 0 disables Live, -1 means unlimited connections.
max_connections = 100

# message_size_limit is the maximum size in bytes of Websocket messages from clients. Defaults to 64KB.
# The limit can be disabled by setting it to -1.
message_size_limit = 65536

# allowed_origins is a comma-separated list of origins that can establish connection with Grafana Live.
# If not set then origin will be matched over root_url. Supports wildcard symbol "*".
allowed_origins =

# engine defines an HA (high availability) engine to use for Grafana Live. By default no engine used - in
# this case Live features work only on a single Grafana server.
# Available options: "redis".
ha_engine =

# ha_engine_address sets a connection address for Live HA engine. Depending on engine type address format can differ.
# For now we only support Redis connection address in "host:port" format.
ha_engine_address = "127.0.0.1:6379"

# ha_engine_password allows setting an optional password to authenticate with the engine
ha_engine_password = ""

# ha_prefix is a prefix for keys in the HA engine. It's used to separate keys for different Grafana instances.
ha_prefix =

#################################### Grafana Image Renderer Plugin ##########################
[plugin.grafana-image-renderer]
# Instruct headless browser instance to use a default timezone when not provided by Grafana, e.g. when rendering panel image of alert.
# See ICU’s metaZones.txt (https://cs.chromium.org/chromium/src/third_party/icu/source/data/misc/metaZones.txt) for a list of supported
# timezone IDs. Fallbacks to TZ environment variable if not set.
rendering_timezone =

# Instruct headless browser instance to use a default language when not provided by Grafana, e.g. when rendering panel image of alert.
# Please refer to the HTTP header Accept-Language to understand how to format this value, e.g. 'fr-CH, fr;q=0.9, en;q=0.8, de;q=0.7, *;q=0.5'.
rendering_language =

# Instruct headless browser instance to use a default device scale factor when not provided by Grafana, e.g. when rendering panel image of alert.
# Default is 1. Using a higher value will produce more detailed images (higher DPI), but will require more disk space to store an image.
rendering_viewport_device_scale_factor =

# Instruct headless browser instance whether to ignore HTTPS errors during navigation. Per default HTTPS errors are not ignored. Due to
# the security risk it's not recommended to ignore HTTPS errors.
rendering_ignore_https_errors =

# Instruct headless browser instance whether to capture and log verbose information when rendering an image. Default is false and will
# only capture and log error messages. When enabled, debug messages are captured and logged as well.
# For the verbose information to be included in the Grafana server log you have to adjust the rendering log level to debug, configure
# [log].filter = rendering:debug.
rendering_verbose_logging =

# Instruct headless browser instance whether to output its debug and error messages into running process of remote rendering service.
# Default is false. This can be useful to enable (true) when troubleshooting.
rendering_dumpio =

# Instruct headless browser instance whether to register metrics for the duration of every rendering step. Default is false.
# This can be useful to enable (true) when optimizing the rendering mode settings to improve the plugin performance or when troubleshooting.
rendering_timing_metrics =

# This is a configuration for OTLP exporter with HTTP protocol, set this URL to enable tracing (ex: http://localhost:4318/v1/traces). Default to empty (tracing disabled).
rendering_tracing_url =

# Additional arguments to pass to the headless browser instance. Default is --no-sandbox. The list of Chromium flags can be found
# here (https://peter.sh/experiments/chromium-command-line-switches/). Multiple arguments is separated with comma-character.
rendering_args =

# You can configure the plugin to use a different browser binary instead of the pre-packaged version of Chromium.
# Please note that this is not recommended, since you may encounter problems if the installed version of Chrome/Chromium is not
# compatible with the plugin.
rendering_chrome_bin =

# Instruct how headless browser instances are created. Default is 'default' and will create a new browser instance on each request.
# Mode 'clustered' will make sure that only a maximum of browsers/incognito pages can execute concurrently.
# Mode 'reusable' will have one browser instance and will create a new incognito page on each request.
rendering_mode =

# When rendering_mode = clustered, you can instruct how many browsers or incognito pages can execute concurrently. Default is 'browser'
# and will cluster using browser instances.
# Mode 'context' will cluster using incognito pages.
rendering_clustering_mode =
# When rendering_mode = clustered, you can define the maximum number of browser instances/incognito pages that can execute concurrently. Default is '5'.
rendering_clustering_max_concurrency =
# When rendering_mode = clustered, you can specify the duration a rendering request can take before it will time out. Default is `30` seconds.
rendering_clustering_timeout =

# Limit the maximum viewport width, height and device scale factor that can be requested.
rendering_viewport_max_width =
rendering_viewport_max_height =
rendering_viewport_max_device_scale_factor =

# Change the listening host and port of the gRPC server. Default host is 127.0.0.1 and default port is 0 and will automatically assign
# a port not in use.
grpc_host =
grpc_port =

[enterprise]
license_path =

[feature_toggles]
# there are currently two ways to enable feature toggles in the `grafana.ini`.
# you can either pass an array of feature you want to enable to the `enable` field or
# configure each toggle by setting the name of the toggle to true/false. Toggles set to true/false
# will take precedence over toggles in the `enable` list.

# enable = feature1,feature2
enable =

# Some features are enabled by default, see:
# https://grafana.com/docs/grafana/next/setup-grafana/configure-grafana/feature-toggles/
# To enable features by default, set `Expression:  "true"` in:
# https://github.com/grafana/grafana/blob/main/pkg/services/featuremgmt/registry.go

# feature1 = true
# feature2 = false

[feature_toggles.openfeature]
# This is EXPERIMENTAL. Please, do not use this section
provider = static

[feature_toggles.openfeature.context]
# This is EXPERIMENTAL. Please, do not use this section
# instance = "grafana"
# version = 11.0.0

[time_picker]
# Custom quick ranges for the time picker. Each quick range has a display name, a from value, and a to value.
# Format: [{"from":"now-5m","to":"now","display":"Last 5 minutes"},{"from":"now-15m","to":"now","display":"Last 15 minutes"}]
quick_ranges =

[date_formats]
# For information on what formatting patterns that are supported https://momentjs.com/docs/#/displaying/

# Default system date format used in time range picker and other places where full time is displayed
full_date = YYYY-MM-DD HH:mm:ss

# Used by graph and other places where we only show small intervals
interval_second = HH:mm:ss
interval_minute = HH:mm
interval_hour = MM/DD HH:mm
interval_day = MM/DD
interval_month = YYYY-MM
interval_year = YYYY

# Experimental feature
use_browser_locale = false

# Default timezone for user preferences. Options are 'browser' for the browser local timezone or a timezone name from IANA Time Zone database, e.g. 'UTC' or 'Europe/Amsterdam' etc.
default_timezone = browser

[expressions]
# Enable or disable the expressions functionality.
enabled = true

[geomap]
# Set the JSON configuration for the default basemap
default_baselayer_config =

# Enable or disable loading other base map layers
enable_custom_baselayers = true

#################################### Support Bundles #####################################
[support_bundles]
# Enable support bundle creation (default: true)
enabled = true
# Only server admins can generate and view support bundles (default: true)
server_admin_only = true
# If set, bundles will be encrypted with the provided public keys separated by whitespace
public_keys = ""

#################################### Storage ################################################

[storage]
# Allow uploading SVG files without sanitization.
allow_unsanitized_svg_upload = false

#################################### Search ################################################

[search]
# Defines the number of dashboards loaded at once in a batch during a full reindex.
# This is a temporary settings that might be removed in the future.
dashboard_loading_batch_size = 200

# Defines the frequency of a full search reindex.
# This is a temporary settings that might be removed in the future.
full_reindex_interval = 5m

# Defines the frequency of partial index updates based on recent changes such as dashboard updates.
# This is a temporary settings that might be removed in the future.
index_update_interval = 10s

# Move an app plugin referenced by its id (including all its pages) to a specific navigation section
# Format: <Plugin ID> = <Section ID> <Sort Weight>
[navigation.app_sections]

# Move a specific app plugin page (referenced by its `path` field) to a specific navigation section
# Format: <Page URL> = <Section ID> <Sort Weight>
[navigation.app_standalone_pages]

#################################### Secure Socks5 Datasource Proxy #####################################
[secure_socks_datasource_proxy]
enabled = false
root_ca_cert =
client_key =
client_cert =
server_name =
# The address of the socks5 proxy datasources should connect to
proxy_address =
# Determines if the secure socks proxy should be shown on the datasources page, defaults to true if the feature is enabled
show_ui = true
# Disables TLS in the secure socks proxy
allow_insecure = false

################################## Feature Management ##############################################
# Options to configure the experimental Feature Toggle Admin Page feature, which is behind the `featureToggleAdminPage` feature toggle. Use at your own risk.
[feature_management]
# Allows editing of feature toggles in the feature management page
allow_editing = false

# Allow customization of URL for the controller that manages feature toggles
update_webhook =

# Allow configuring an auth token for feature management update requests
update_webhook_token =

# Hides specific feature toggles from the feature management page
hidden_toggles =

# Disables updating specific feature toggles in the feature management page
read_only_toggles =

#################################### Public Dashboards #####################################
[public_dashboards]
# Set to false to disable public dashboards
enabled = true

###################################### Cloud Migration ######################################
[cloud_migration]
# Set to true to enable target-side migration UI
is_target = false
# Token used to send requests to grafana com
gcom_api_token = ""
# How long to wait for a request sent to gms to start a snapshot to complete
start_snapshot_timeout = 5s
# How long to wait for a request sent to gms to validate a key to complete
validate_key_timeout = 5s
# How long to wait for a request sent to gms to get a snapshot status to complete
get_snapshot_status_timeout = 5s
# How long to wait for a request sent to gms to create a presigned upload url
create_upload_url_timeout = 5s
# How long to wait for a request sent to gms to report an event
report_event_timeout = 5s
# How long to wait for a request to fetch an instance to complete
fetch_instance_timeout = 5s
# How long to wait for a request to create an access policy to complete
create_access_policy_timeout = 5s
# How long to wait for a request to create to fetch an access policy to complete
fetch_access_policy_timeout = 5s
# How long to wait for a request to create to delete an access policy to complete
delete_access_policy_timeout = 5s
# The domain name used to access cms
domain = grafana.net
# Folder used to store snapshot files. Defaults to the home dir
snapshot_folder = ""
# How frequently should the frontend UI poll for changes while resources are migrating
frontend_poll_interval = 2s
# Controls how the Alert Rules are migrated. Available choices: "paused" and "unchanged". Default: "paused".
# With "paused", all Alert Rules will be created in Paused state. This is helpful to avoid double notifications.
# With "unchanged", all Alert Rules will be created with the pause state unchanged coming from the source instance.
alert_rules_state = "paused"

###################################### Secrets Manager ######################################
[secrets_manager]
# Used for signing
secret_key = ${MASKED}
# Current key provider used for envelope encryption, default to static value specified by secret_key
encryption_provider = secretKey.v1
# List of configured key providers, space separated (Enterprise only): e.g., awskms.v1 azurekv.v1
available_encryption_providers =

################################## Frontend development configuration ###################################
# Warning! Any settings placed in this section will be available on `process.env.frontend_dev_{foo}` within frontend code
# Any values placed here may be accessible to the UI. Do not place sensitive information here.
[frontend_dev]
# Should UI tests fail when console log/warn/erroring?
# Does not affect the result when running on CI - only for allowing devs to choose this behaviour locally
fail_tests_on_console = true
# Whether to enable betterer eslint rules for local development
# Useful if you want to always see betterer rules that we're trying to fix so they're more prevalent
betterer_eslint_rules = false
¶ 하위 문서
¶ Grafana 설치
- 13.2.2 패키지 · tarball 설치와
grafana.ini주요 항목.
¶ Grafana 데이터 소스 관리
- 프로비저닝 파일로 데이터 소스를 관리한다.
¶ Grafana Dashboard
- 대시보드 JSON 프로비저닝과 공개 대시보드 가져오기.
¶ Grafana Alert
- Unified Alerting 규칙 · contact point · 알림 정책.
¶ Grafana database is locked 해결
- Grafana 가
database is locked를 내며 저장·로그인이 실패하는 것은 기본 백엔드인 SQLite 의 파일 잠금이 풀리지…
¶ Grafana 변수와 시간 매크로
- 같은 대시보드를 여러 대상에 재사용하려면 쿼리에 박힌 값을 변수로 빼야 한다. Grafana 의 변수는 대시보드 상단의 드롭다운으로 노출되고…
¶ Grafana 에서 오늘 00시 기준으로 조회하기
- "오늘 00시부터 지금까지" 는 Grafana 의 시간 범위 표기로 그대로 표현된다. 시간 선택기에서 From 과 To 를 다음과 같이 둔다.
¶ 트러블슈팅
¶ Grafana 문제 해결
최신 버전 OSS 13.2.2 (2026-09-15) — 2026-09-20 확인. https://grafana.com/grafana/download?edition=oss ↩︎