¶ Prometheus
¶ 개요
Prometheus 는 수집 대상의 HTTP 엔드포인트를 주기적으로 긁어(pull) 시계열로 쌓는 오픈소스 모니터링 도구다. 질의는 PromQL 로 하고 라이선스는 Apache 2.0 이다. 수집 대상은 exporter 가 만들고, 화면은 Grafana 에서 본다.
¶ 버전
| 계열 | 상태 |
|---|---|
| 3.14.0 | 현행.[1] |
| 3.13.3 | LTS. 장기 유지보수 |
| 2.x | 지난 계열 |
함께 쓰는 것들의 현행은 Alertmanager 0.34.1, node_exporter 1.12.1 이다.
¶ 2.x 에서 올릴 때 주의
3.0 에서 끊긴 것들이 있다. 아래 네 가지는 2.x 시절의 시작 명령과 설정을 그대로 쓰면 걸린다.
- 기본값이 된 기능 플래그는 주면 경고가 난다 —
promql-at-modifier,promql-negative-offset,expand-external-labels,no-default-scrape-port,new-service-discovery-manager. --enable-feature=agent는--agent플래그로,remote-write-receiver는--web.enable-remote-write-receiver로 바뀜다.- 수집 대상이 Content-Type 헤더를 주지 않으면 스크레이프가 실패한다.
fallback_scrape_protocol을 지정해야 한다. le·quantile라벨 값이 정규화된다 (le="1"→le="1.0"). 기존 대시보드 질의를 고쳐야 할 수 있다.- TSDB 형식이 바뀌어 2.55 미만으로는 되돌릴 수 없다. Alertmanager 는 0.16.0 이상이어야 한다.
¶ 요구사항
| 항목 | 내용 |
|---|---|
| 바이너리 | 단일 정적 바이너리. 런타임 없음 |
| 포트 | 9090 (기본). TLS 를 쓰면 --web.config.file 로 지정 |
| 디스크 | TSDB 경로에 보존 기간 · 수집량에 비례한 공간. --storage.tsdb.retention.size 로 상한을 건다 |
| 시간 | 수집 대상과 시각이 맞아야 한다 |
¶ 설치
아래 기록은 2.53.3 기준으로 작성된 것이다. 현행 3.14.0 으로 올릴 때는 버전 문자열만 바꾸면 경로 구성은 같다.
PROM_VER=3.14.0
wget https://github.com/prometheus/prometheus/releases/download/v${PROM_VER}/prometheus-${PROM_VER}.linux-amd64.tar.gz
tar -xvzf prometheus-${PROM_VER}.linux-amd64.tar.gz
¶ 운영 기록
Prometheus는 이벤트 모니터링 및 알림 등에 사용되는 오픈소스 시계열 DB이다. 라이선스는 APL2.0이다. PromQL을 이용해 데이터에 접근할 수 있다.
¶ 설치 파일 다운로드
¶ 압축 해제 및 변수 설정
- user 명, 각 디렉토리, 파일 명 등은 상황에 맞게 수정한다.
# Prometheus user 생성
useradd haedong

# Prometheus Log 디렉토리 생성 및 권한 부여
mkdir -p /var/log/prometheus
chown -R haedong /var/log/prometheus

# TSDB 디렉토리 생성 및 권한 부여
mkdir -p /xvdb/prometheus/tsdb
chown -R haedong /xvdb/prometheus

# prometheus user 환경 변수
sudo -i -u haedong
cat <<EOF | sudo tee /home/haedong/.bash_profile
export HOME=/home/haedong
export PROMETHEUS_HOME=\$HOME/prometheus
export PATH=\$PATH:\$PROMETHEUS_HOME/bin
EOF
source ~/.bash_profile
wget https://github.com/prometheus/prometheus/releases/download/v2.53.3/prometheus-2.53.3.linux-amd64.tar.gz
tar -xvzf prometheus-2.53.3.linux-amd64.tar.gz
mkdir -p $HOME/apps
mv prometheus-2.53.3.linux-amd64 $HOME/apps/
ln -s /home/haedong/apps/prometheus-2.53.3.linux-amd64 $HOME/prometheus
mkdir $PROMETHEUS_HOME/bin
mv $PROMETHEUS_HOME/prometheus  $PROMETHEUS_HOME/bin/
mv $PROMETHEUS_HOME/promtool $PROMETHEUS_HOME/bin/
mkdir $PROMETHEUS_HOME/conf
mv $PROMETHEUS_HOME/prometheus.yml $PROMETHEUS_HOME/conf
¶ systemctl script
[Unit]
Description=Prometheus Monitoring
Wants=network-online.target
After=network-online.target

[Service]
User=prometheus
Group=prometheus
Type=simple
Environment=PROMETHEUS_HOME=/opt/prometheus
Environment=CONFIG_FILE=/etc/prometheus/prometheus.yml
Environment=WEB_CONFIG=/etc/prometheus/web-config.yml
Environment=TSDB_PATH=/xvdb/prometheus/tsdb/
Environment=LISTEN_ADDRESS=0.0.0.0:9443
Environment=TSDB_RETENTION_TIME=15d
Environment=TSDB_RETENTION_SIZE=8GB

ExecStart=/opt/prometheus/bin/prometheus \
  --config.auto-reload-interval=30s \
  --config.file=${CONFIG_FILE} \
  --web.config.file=${WEB_CONFIG} \
  --web.listen-address=${LISTEN_ADDRESS} \
  --storage.tsdb.path=${TSDB_PATH} \
  --storage.tsdb.retention.time=${TSDB_RETENTION_TIME} \
  --storage.tsdb.retention.size=${TSDB_RETENTION_SIZE} \
  --web.enable-lifecycle \
  --log.level=info \
  --web.console.templates=/etc/prometheus/consoles \
  --web.console.libraries=/etc/prometheus/console_libraries

Restart=always

StandardOutput=append:/var/log/prometheus/prometheus.log
StandardError=append:/var/log/prometheus/prometheus.err

[Install]
WantedBy=multi-user.target
¶ 설정 파일
- Prometheus 기본 설정
$PROMETHEUS_HOME/conf/prometheus.yml
# my global config
global:
  scrape_interval: 15s # Set the scrape interval to every 15 seconds. Default is every 1 minute.
  evaluation_interval: 15s # Evaluate rules every 15 seconds. The default is every 1 minute.
  # scrape_timeout is set to the global default (10s).

# Alertmanager configuration
alerting:
  alertmanagers:
    - static_configs:
        - targets:
          # - alertmanager:9093

# Load rules once and periodically evaluate them according to the global 'evaluation_interval'.
rule_files:
  # - "first_rules.yml"
  # - "second_rules.yml"

# A scrape configuration containing exactly one endpoint to scrape:
# Here it's Prometheus itself.
scrape_configs:
  # 기본 설정
  # The job name is added as a label `job=<job_name>` to any timeseries scraped from this config.
  - job_name: "prometheus"
    # metrics_path defaults to '/metrics'
    # scheme defaults to 'http'.
    static_configs:
      - targets: ["localhost:9090"]

  - job_name: "K8s Master node status"
    static_configs:
      - targets: ["HOST.DOMAIN.NAME:60001", "IP.ADDR.NUM:60001"]

# 수집 대상에 TLS 설정, 인증 설정 등이 적용 돼있을 경우
  - job_name: "Node Information https"
    scheme: https
    metrics_path: '/actuator/nodes'
    authorization:
      type: Bearer
      credentials: ${BEARER_TOKEN}
    tls_config:
      insecure_skip_verify: true
    static_configs:
      - targets: ["HOST.DOMAIN.NAME:7777", "IP.ADDR.NUM:7777"]
- TLS 적용 시, 인증서 파일 정보 관련 설정
$PROMETHEUS_HOME/conf/web.yml
tls_server_config:
  # Certificate and key files for server to use to authenticate to client.
  cert_file: /home/haedong/prometheus/certs/haedongg.net.crt
  key_file: /home/haedong/prometheus/certs/haedongg.net.key
- web.yml - TLS 연결 설정 시 (redmine 판. 경로와 인증서가 다른 예시)
tls_server_config:
  # Certificate and key files for server to use to authenticate to client.
  cert_file: /home/services/prometheus/certs/haedongg.crt
  key_file: /home/services/prometheus/certs/haedongg.key
- ruls_alert_cpu.yml
groups:
  - name: io_wait
    rules:
      - alert:
        expr: 100 * (rate(node_cpu_seconds_total{mode="iowait"}[1m])) > 1
        for: 1m
        labels:
          severity: critical
        annotations:
          summary: "io wait high load on {{ $labels.instance }}"
          description: "{{ $labels.instance }} has load1 = {{ $value }} (>5)"
  - name: node_alerts
    rules:
      - alert: VeryHighLoad
        expr: node_load1 > 1
        for: 1m
        labels:
          severity: critical
        annotations:
          summary: "Very high load on {{ $labels.instance }}"
          description: "{{ $labels.instance }} has load1 = {{ $value }} (>16)"
  - name: io_wait
    rules:
      - alert: IOWaitHigh
        expr: 100 * (rate(node_cpu_seconds_total{mode="iowait"}[10s])) > 0.01
        for: 10s
        labels:
          severity: critical
        annotations:
          summary: "io wait high load on {{ $labels.instance }}"
          description: "{{ $labels.instance }} has load1 = {{ $value }} (>5)"
¶ 시작 / 종료
- 시작 명령
# TLS를 적용하지 않는 경우 --web.config.file 플래그는 넣지 않는다.
# 재기동 없이 설정 변경 적용을 위해 --web.enable-lifecycle 를 추가한다.
nohup $PROMETHEUS_HOME/bin/prometheus \
      --config.file=$PROMETHEUS_HOME/conf/prometheus.yml \
      --web.listen-address="0.0.0.0:9443" \
      --web.config.file=$PROMETHEUS_HOME/conf/web.yml \
      --storage.tsdb.path=/xvdb/prometheus/tsdb \
      --storage.tsdb.retention.time=30d \
      --storage.tsdb.retention.size=100GB \
      --web.enable-lifecycle \
      --log.level=info \
      > /var/log/prometheus/prometheus.log 2>&1 &
- 시작 / 종료 스크립트 예시
$PROMETHEUS_HOME/prometheus.sh
#!/bin/bash

# Prometheus variables
PROMETHEUS_HOME="/home/haedong/prometheus"
PROMETHEUS_BIN="$PROMETHEUS_HOME/bin/prometheus"
PROMETHEUS_CONFIG="$PROMETHEUS_HOME/conf/prometheus.yml"
PROMETHEUS_WEB_CONFIG="$PROMETHEUS_HOME/conf/web.yml"
TSDB_DIR="/xvdb/prometheus/tsdb"
PID_FILE="$PROMETHEUS_HOME/prometheus.pid"
PROMETHEUS_LOG_DIR=/var/log/prometheus
TSDB_RETENTION_PERIOD=30d
TSDB_RETENTION_SIZE=100GB

# Function to start Prometheus
start_prometheus() {
    if [ -f "$PID_FILE" ]; then
        echo "Prometheus is already running (PID $(cat $PID_FILE))."
    else
        echo "Starting Prometheus..."
        nohup $PROMETHEUS_BIN --config.file=$PROMETHEUS_CONFIG \
          --web.listen-address="0.0.0.0:9443" \
          --web.config.file=$PROMETHEUS_WEB_CONFIG \
          --storage.tsdb.path=$TSDB_DIR \
          --storage.tsdb.retention.time=$TSDB_RETENTION_PERIOD \
          --storage.tsdb.retention.size=$TSDB_RETENTION_SIZE \
          --web.enable-lifecycle \
          --log.level=info \
          > $PROMETHEUS_LOG_DIR/prometheus.log 2>&1 &
        echo $! > $PID_FILE
        echo "Prometheus started with PID $(cat $PID_FILE)."
    fi
}

# Function to stop Prometheus
stop_prometheus() {
    if [ -f "$PID_FILE" ]; then
        PID=$(cat $PID_FILE)
        echo "Stopping Prometheus (PID $PID)..."
        kill $PID
        rm -f $PID_FILE
        echo "Prometheus stopped."
    else
        echo "Prometheus is not running."
    fi
}

# Function to restart Prometheus
restart_prometheus() {
    stop_prometheus
    start_prometheus
}

# Function to check status
status_prometheus() {
    if [ -f "$PID_FILE" ]; then
        echo "Prometheus is running (PID $(cat $PID_FILE))."
    else
        echo "Prometheus is not running."
    fi
}

# Main script execution
case "$1" in
    start)   start_prometheus ;;
    stop)    stop_prometheus ;;
    restart) restart_prometheus ;;
    status)  status_prometheus ;;
    *)       echo "Usage: $0 {start|stop|restart|status}"; exit 1 ;;
esac
- prometheus.sh (redmine 판. 경로·포트·retention 값이 다른 예시)
# vi $PROMETHEUS_HOME/prometheus.sh
#!/bin/bash

# Prometheus variables
PROMETHEUS_HOME="/home/prometheus/prometheus"
PROMETHEUS_BIN="$PROMETHEUS_HOME/bin/prometheus"
PROMETHEUS_CONFIG="$PROMETHEUS_HOME/conf/prometheus.yaml"
TSDB_DIR="/xvdb/prometheus/tsdb"
PID_FILE="$PROMETHEUS_HOME/prometheus.pid"
PROMETHEUS_LOG_DIR=/var/log/prometheus
TSDB_RETENTION_PERIOD=30d
TSDB_RETENTION_SIZE=1GB

# Function to start Prometheus
start_prometheus() {
    if [ -f "$PID_FILE" ]; then
        echo "Prometheus is already running (PID $(cat $PID_FILE))."
    else
        echo "Starting Prometheus..."
        nohup $PROMETHEUS_BIN --config.file=$PROMETHEUS_CONFIG \
        --web.listen-address="0.0.0.0:9090" --web.config.file=$PROMETHEUS_CNFIG/web-conf.yaml \
        --storage.tsdb.path=$TSDB_DIR --storage.tsdb.retention.time=$TSDB_RETENTION_PERIOD --storage.tsdb.retention.size=$TSDB_RETENTION_SIZE \
        --web.enable-lifecycle \
        --log.level=info > $PROMETHEUS_LOG_DIR/prometheus.log 2>&1 &
        echo $! > $PID_FILE
        echo "Prometheus started with PID $(cat $PID_FILE)."
    fi
}

# Function to stop Prometheus
stop_prometheus() {
    if [ -f "$PID_FILE" ]; then
        PID=$(cat $PID_FILE)
        echo "Stopping Prometheus (PID $PID)..."
        kill $PID
        rm -f $PID_FILE
        echo "Prometheus stopped."
    else
        echo "Prometheus is not running."
    fi
}

# Function to restart Prometheus
restart_prometheus() {
    stop_prometheus
    start_prometheus
}

# Function to check status
status_prometheus() {
    if [ -f "$PID_FILE" ]; then
        echo "Prometheus is running (PID $(cat $PID_FILE))."
    else
        echo "Prometheus is not running."
    fi
}

# Main script execution
case "$1" in
    start)
        start_prometheus
        ;;
    stop)
        stop_prometheus
        ;;
    restart)
        restart_prometheus
        ;;
    status)
        status_prometheus
        ;;
    *)
        echo "Usage: $0 {start|stop|restart|status}"
        exit 1
        ;;
esac
¶ Refresh (설정 재로드 / 설정 반영)
- prometheus.yml에 있는 수집 대상 목록을 변경 했을 때 수행한다.
# curl -X POST <your_prometheus_server_url>:<port>/-/reload

curl -X POST https://prometheus.haedongg.net:9443/-/reload

curl -X POST prometheus.haedongg.net:49443/-/reload
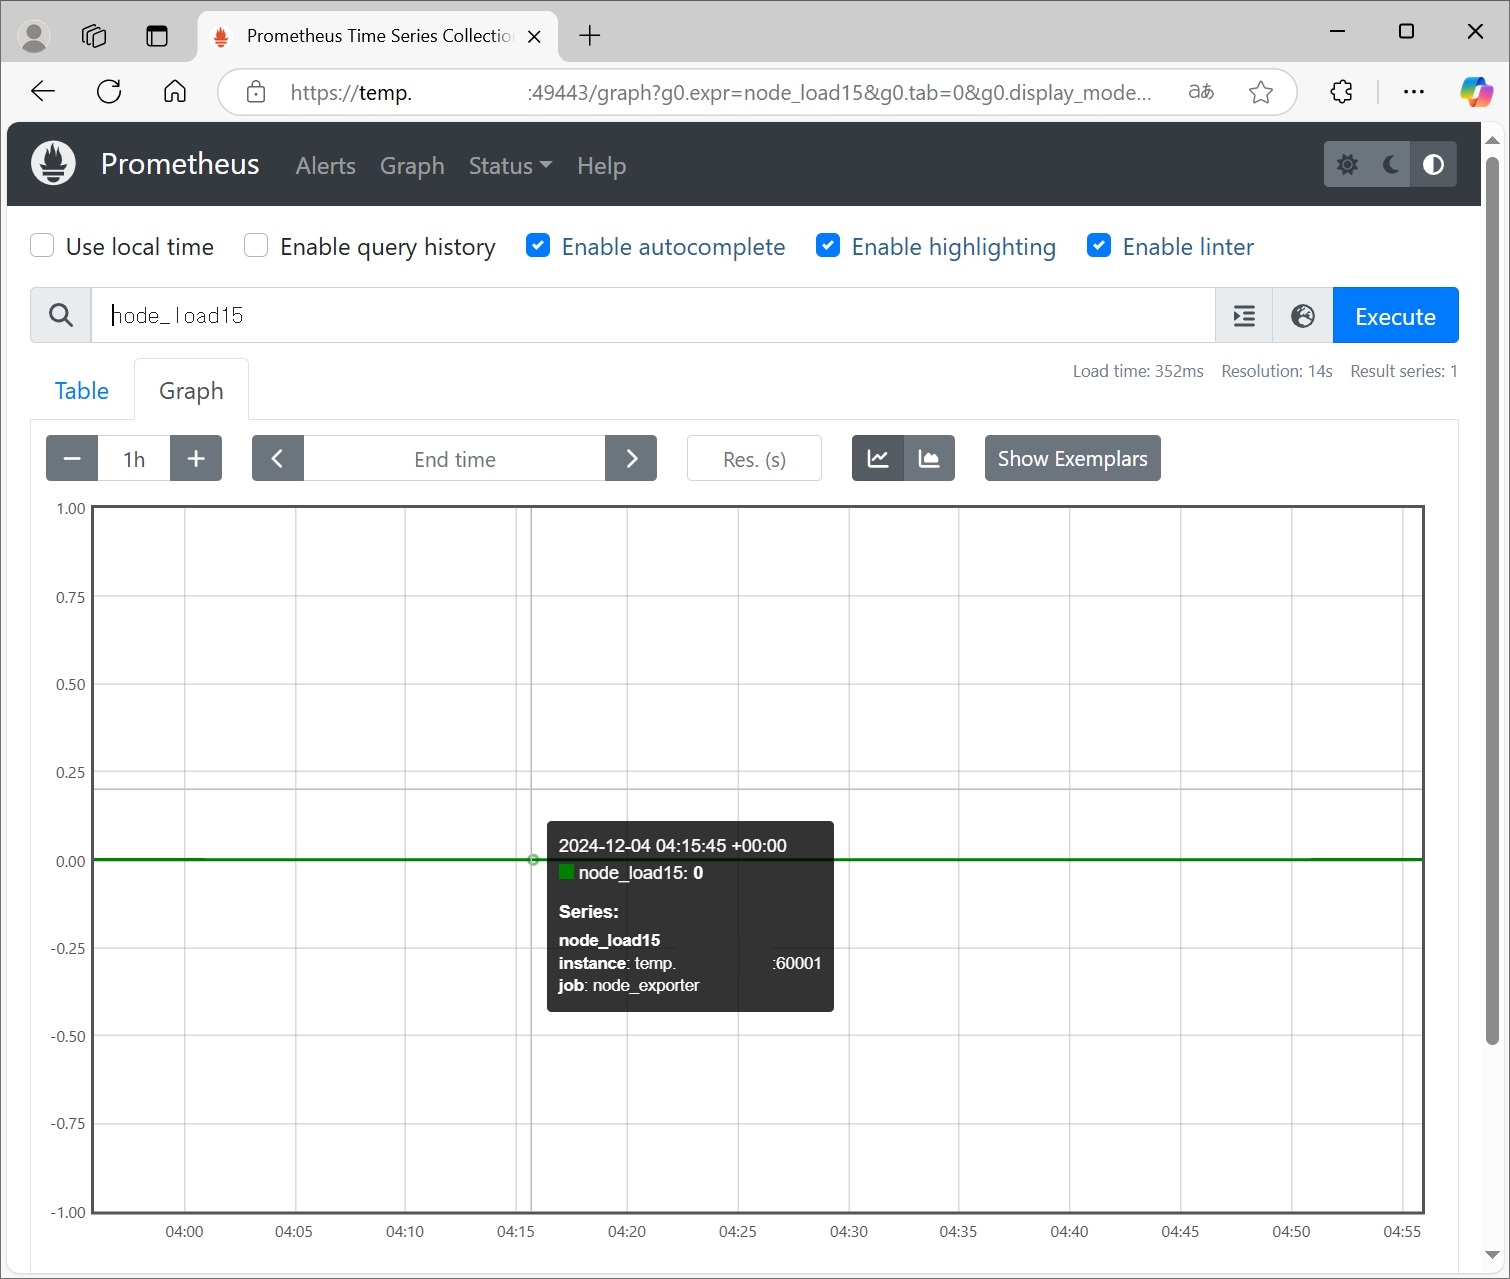
¶ 하위 문서
¶ Prometheus 컨테이너 배포
- 이미지로 올릴 때의 디렉터리 권한과 compose 구성.
¶ Prometheus Alert Manager
- 경로와 서비스 등록, webhook 예제.
¶ Kubernetes 모니터링 스택 버전 조합 — Trino · DB exporter · Prometheus · Grafana
- 쿠버네티스에 올릴 때 서로 맞는 차트 · 이미지 버전 조합.
¶ Alertmanager 로 스크립트 실행하기
- "부하가 임계치를 넘으면 스크립트를 돌리고 싶다" 는 요구는 흔하지만 Alertmanager 는 셸 명령을 직접 실행하지 못한다. 수신자로 지…
¶ node_exporter 디스크 I/O PromQL
node_exporter가 노출하는 디스크 메트릭은 모두 부팅 이후 누적되는 카운터다. 값을 그대로 그리면 계속 올라가는 직선만 나오므로…
¶ Prometheus file_sd 타깃 관리와 TSDB 튜닝
- Prometheus 설정은 성격이 다른 두 곳에 나뉘어 있다. 무엇을 수집할지는
prometheus.yml에 적고, 데이터를 어떻게 저장…
¶ PromQL 집계와 Grafana 범례
- PromQL 에는 SQL 의
GROUP BY에 해당하는 독립된 구문이 없다. 집계 연산자에by또는without절을 붙여 어…
¶ node_exporter CPU · 메모리 메트릭과 질의
node_exporter는 리눅스 호스트의/proc과/sys를 읽어 Prometheus 형식으로 노출한다. 디스크 I/O…
¶ PromQL rate · avg_over_time 과 스칼라
[1m]을 붙인 질의는 모두 "최근 1분" 을 다루지만, 지표 종류에 따라 써야 할 함수가 다르다.
¶ 트러블슈팅
¶ Prometheus 문제 해결
최신 버전 3.14.0 (LTS 3.13.3) · Alertmanager 0.34.1 · node_exporter 1.12.1 — 2026-09-20 확인. https://prometheus.io/download/ ↩︎